
🚀 Read this must-read post from Hacker News 📖
📂 **Category**:
💡 **What You’ll Learn**:
Oded Rechavi, at QED Science, believes that if your paper is not in the
top 1% of their QED score then it
“sucks”. But what is this QED score and what is its purpose? Does it really
measure scientific quality? If a paper is not in the 1% does it really
suck?

These are important questions because scientists are increasingly
overwhelmed with the volume of new work posted on preprint servers and
published in journals. As a result, traditional quality signals used
for triaging papers, such as journal, conference venue, and institution,
are becoming less reliable. AI further compounds this problem by making
it easy to produce plausible scientific writing at scale. Papers are
longer, figures are denser, and the existence of a paper is no longer
sufficient evidence that it represents substantial scientific work.
In response, companies like QED Science are building AI tools to help
scientists identify quality work. QED uses Large Language Models (LLMs)
to review scientific papers and provide AI feedback. Many scientists
report that the feedback is useful and often resembles comments received
during human peer review.
QED recently released a
white paper
that goes one step further and describes the “QED Score”, a single
number that is intended to measure a paper’s quality. The QED score is
generated by prompting a collection of LLMs to review a paper for
“originality” and “validity”. The resulting evaluations are combined
into a single score, the QED score. In their white paper, the authors
claim that the QED score is a “more accurate, faster, and less biased
estimate of paper quality than journal rank.” The authors present three
validation studies, all of which compare the QED score against the
SCImago Journal Rank (SJR), a journal-level metric based on citation data. The first study
compares QED and SJR against a corpus of expert-assigned labels
(“Limited”, “Satisfactory”, and “Strong”). The second compares QED
scores for 2,879 bioRxiv preprints with the SJR of the journals in which
those papers were eventually published. The third asks experts to choose
between pairs of papers where QED and SJR disagree most strongly.
In this review, I evaluate the evidence supporting the QED score as a
measure of scientific quality. While QED clearly provides a much faster
review than traditional peer review, I find that the evidence presented
does not support the authors’ claims that the QED score is a more
accurate or less biased measure of scientific quality.
Case study 1 is methodologically opaque and does not effectively
demonstrate that the QED score measures quality
In case study 1, the authors obtain a curated dataset of 975 published
papers labelled “Limited”, “Satisfactory”, or “Strong” by a panel of
expert reviewers whose identities are not disclosed. Each paper received
a label based on validity and originality, the same criteria used to
generate the QED score. The authors then asked whether the QED or the
SJR score better predicted these labels. QED achieved an AUC of 0.863
versus SJR’s 0.804 for distinguishing “Limited” from “Satisfactory +
Strong” papers, and 0.782 versus 0.774 for distinguishing “Strong” from
“Satisfactory + Limited” papers.
These values cannot be meaningfully interpreted without the underlying
data and methodology. The paper does not report the distribution of
labels, whether the expert reviewers who generated the benchmark labels
were blinded to journal, author, or institutional identity, nor do they
provide any data or code to reproduce the analysis. The authors also
provide no guarantee that these papers were excluded from the training
data of the LLMs used to evaluate them. Therefore, case study 1 does not
establish that the QED score accurately measures scientific quality.
Case study 2 provides inconsistent evidence that the QED score measures
quality
The second case study compares QED scores for 2,879 bioRxiv preprints
with the SJR score of the journals where those preprints were
eventually published. Across all fields, the authors report a Spearman
correlation of 0.63. Within individual fields, however, the correlations
ranged from 0.78 (Genetics) to 0.39 (Systems Biology).
The authors describe the overall agreement as “substantial”, but
explain weaker agreement in some fields by arguing that the SJR score is
a noisy proxy for quality. This argument is internally inconsistent. If
the SJR score is a reasonable proxy for scientific quality, then the
weaker agreement across fields suggests that the QED score is a weak
proxy for quality. If the SJR score is a noisy proxy for scientific
quality, then agreement with the SJR score cannot be used to validate
the QED score. Either way, by the authors’ own admission, this analysis
does not establish the QED score as an accurate measure of quality.
Case study 3 contains several uncontrolled and unexplained sources of
variation that may bias the QED score’s validation
The third study asks 15 domain experts to compare papers where the QED
and SJR score disagree most strongly. For each paper the authors
subtract log(SJR + 1) from the QED score, compute pairwise
contradictions, and retain the 100 strongest disagreements. Only 70 of
these pairs were reported with “confident” expert judgments; the
remaining 30 were discarded. Among the retained pairs, experts preferred
the higher QED-scored paper roughly three times as often as the higher
SJR-scored paper.
This experiment introduces several uncontrolled and unexplained sources
of variation. First, the QED score is a paper-level metric assigned to a
preprint, whereas the SJR score is a journal-level metric assigned after
peer review. Second, comparisons are made between two different papers
where expert preference may depend on writing style, topic, or
familiarity with the field rather than scientific quality. Finally, the
authors do not explain how “confidence” was defined or why 30% of
comparisons were excluded. Consequently, case study 3 does not provide
sufficient evidence for the superiority of the QED score.
The QED score exhibits geographical bias
The QED score is not just an internal metric. QED publicly released
rankings of the top 1% of bioRxiv preprints and this public release
reveals substantial geographic bias against African and South American
scientists. (Side note that although the white paper states that QED
scored 57,455 bioRxiv preprints, the publicly accessible website
contains 53,938 domain-assigned preprints (571 in the top 1% and 53,367
in the remaining 99%). The discrepancy is not explained.)
The QED website assigns papers geographic regions based on author
affiliations. A paper may belong to multiple regions (e.g. North
America, Europe, Asia, Australia, South America, Africa), meaning a
single author is sufficient for a paper to be classified as African.
Filtering papers by geographical region on the QED website produces a
striking result: only three papers in the top 1% are classified as
African. Yet none is led primarily by African institutions.
The first paper in the top 1%,
TENM4 is an essential transduction component for touch, has 20 authors with primary affiliations in Germany; it is classified
as African because one author has a secondary affiliation in Egypt. The
second paper,
Memory Regulatory T Cells Reprogram into Protective Tfh-like
Effectors in Recurrent Malaria, has ten authors, only one of whom has an African affiliation. The
third,
Modular and redundant genomic architecture underlies combinatorial
mechanism of speciation and adaptive radiation, has eleven authors, again with only one African-affiliated author. In
other words, the top 1% contains no paper led primarily by African
institutions.
In contrast,
Inflammatory Biomarkers of Asymptomatic and Symptomatic
Tuberculosis
addresses a disease that disproportionately affects sub-Saharan Africa
and includes 28 authors with primary African affiliations and only six
with primary European or North American affiliations. Despite being far
more representative of African science, it was ranked in the bottom 99%.
Taking this a step further, the regional classifications exhibit
significant biases. Using the regional classifications reported by QED,
African classifications (3 vs. 933; p = 0.004) and South American
classifications (11 vs. 2,204; p = 0.00055) are significantly
underrepresented among papers in the top 1% relative to the remaining
99%.
Note: Ran Blekhman published
a complementary analysis
demonstrating that the QED top 1% reproduces familiar institutional
biases.
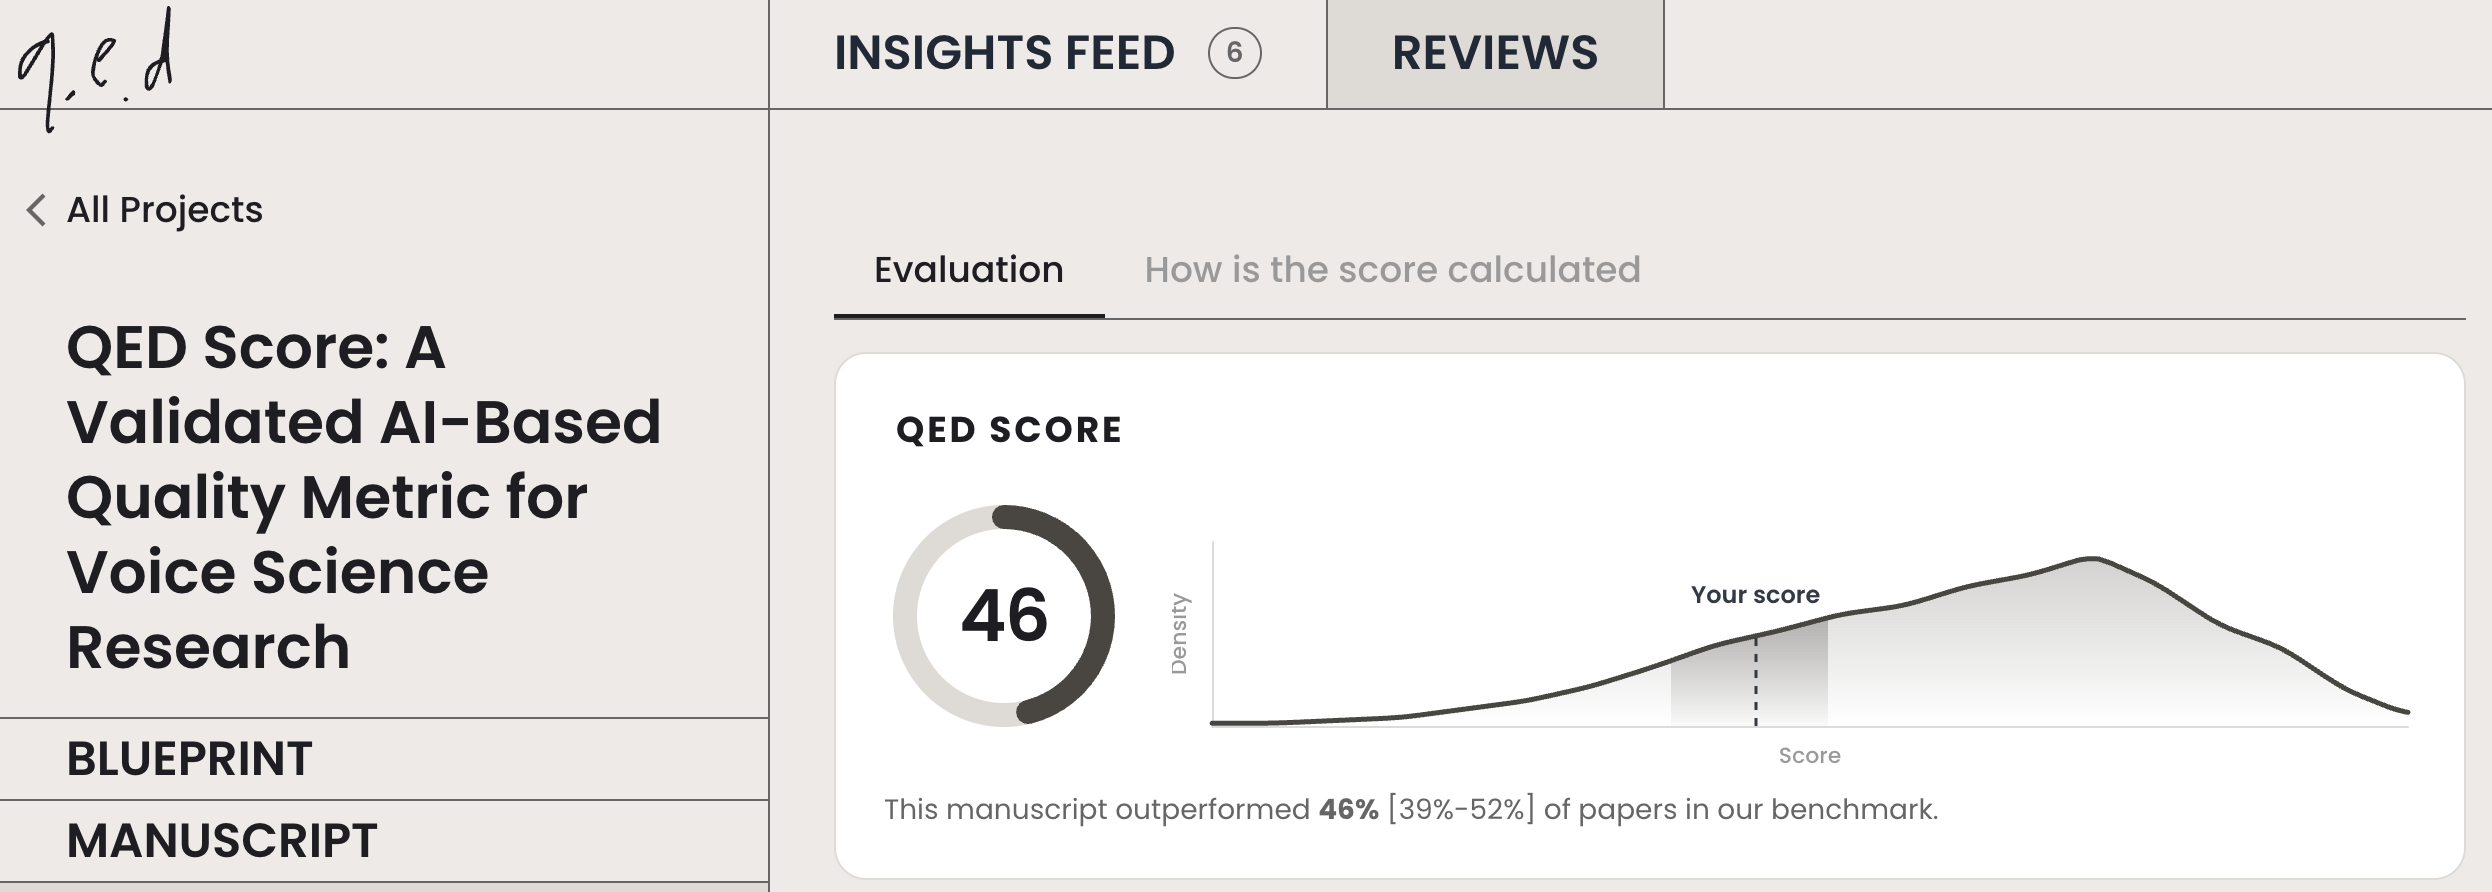
An important sanity check
As an informal experiment, I submitted the QED white paper to QED
itself. The system assigned it a QED score of 46 and identified several
methodological concerns. While this is not a formal validation – the
system was not designed to evaluate methodological white papers – it is
an interesting observation that QED itself identified some, but not all,
of the methodological concerns discussed throughout this review. I’ve
included a link to the review report generated by QED here:
QED review report for the QED Score white paper (PDF)
How do we effectively triage papers?
The rapid growth of scientific publishing is a real problem. AI has
lowered the cost of producing convincing scientific writing, making it
increasingly difficult to identify work worth reading. My concerns with
QED are not with its use of AI, but rather that the evidence presented
does not justify the claims about the score. We scientists need better
systems for organizing, evaluating, and consuming scientific literature.
I believe AI can be part of that solution. Many researchers, myself
included, have found LLMs useful for
indexing scientific papers and providing structured feedback. But assigning every paper a single number is a much stronger claim
than generating useful feedback. Compressing years of scientific work
into a single number inevitably discards too much information that
scientists care about. Such a score should not be treated as a measure
of scientific quality without transparent methodology and rigorous
independent validation.
As this critique explains, the QED score has not been rigorously
validated. The white paper’s three case studies do not demonstrate that
it is a more accurate or less biased measure of scientific quality, and
the released 1% rankings exhibit significant biases. Moreover, the
authors explicitly acknowledge that “precision of ranking within the top
1% has not been independently validated,” despite presenting the top 1%
as the central output of the system. By the standards the authors apply
to other scientific papers, the QED white paper apparently “sucks.”
Should scientists trust a score whose own validation does not meet the
standards it claims to enforce?
💬 **What’s your take?**
Share your thoughts in the comments below!
#️⃣ **#paper #suck**
🕒 **Posted on**: 1782663774
🌟 **Want more?** Click here for more info! 🌟