💥 Read this awesome post from Hacker News 📖
📂 **Category**:
✅ **What You’ll Learn**:


Published: December 11, 2025
We shipped an enhancement to the Chrome DevTools MCP server that many of our
users have been asking for: the ability for coding agents to directly connect to
active browser sessions.
With this enhancement, coding agents are able to:
- Re-use an existing browser session: Imagine you want your coding agent
to fix an issue that is gated behind a sign-in. Your coding agent can now
directly access your current browsing session not requiring an additional
sign-in. - Access active debugging sessions: Coding agents can now access an active
debugging session in the DevTools UI. For example, when you discover a
failing network request in the Chrome DevTools network panel, select the
request and ask your coding agent to investigate it. The same also works
with elements selected in the Elements panel. We are excited about this new
ability to seamlessly transition between manual and AI-assisted debugging.
See it in action:
The auto connection feature is an addition to the existing ways for the Chrome
DevTools MCP to connect to a Chrome instance. Note that you can still:
- Run Chrome with a Chrome DevTools MCP server-specific user profile (current
default). - Connect to a running Chrome instance with a remote debug port.
- Run multiple Chrome instances in isolation with each instance running in a
temporary profile.
How it works
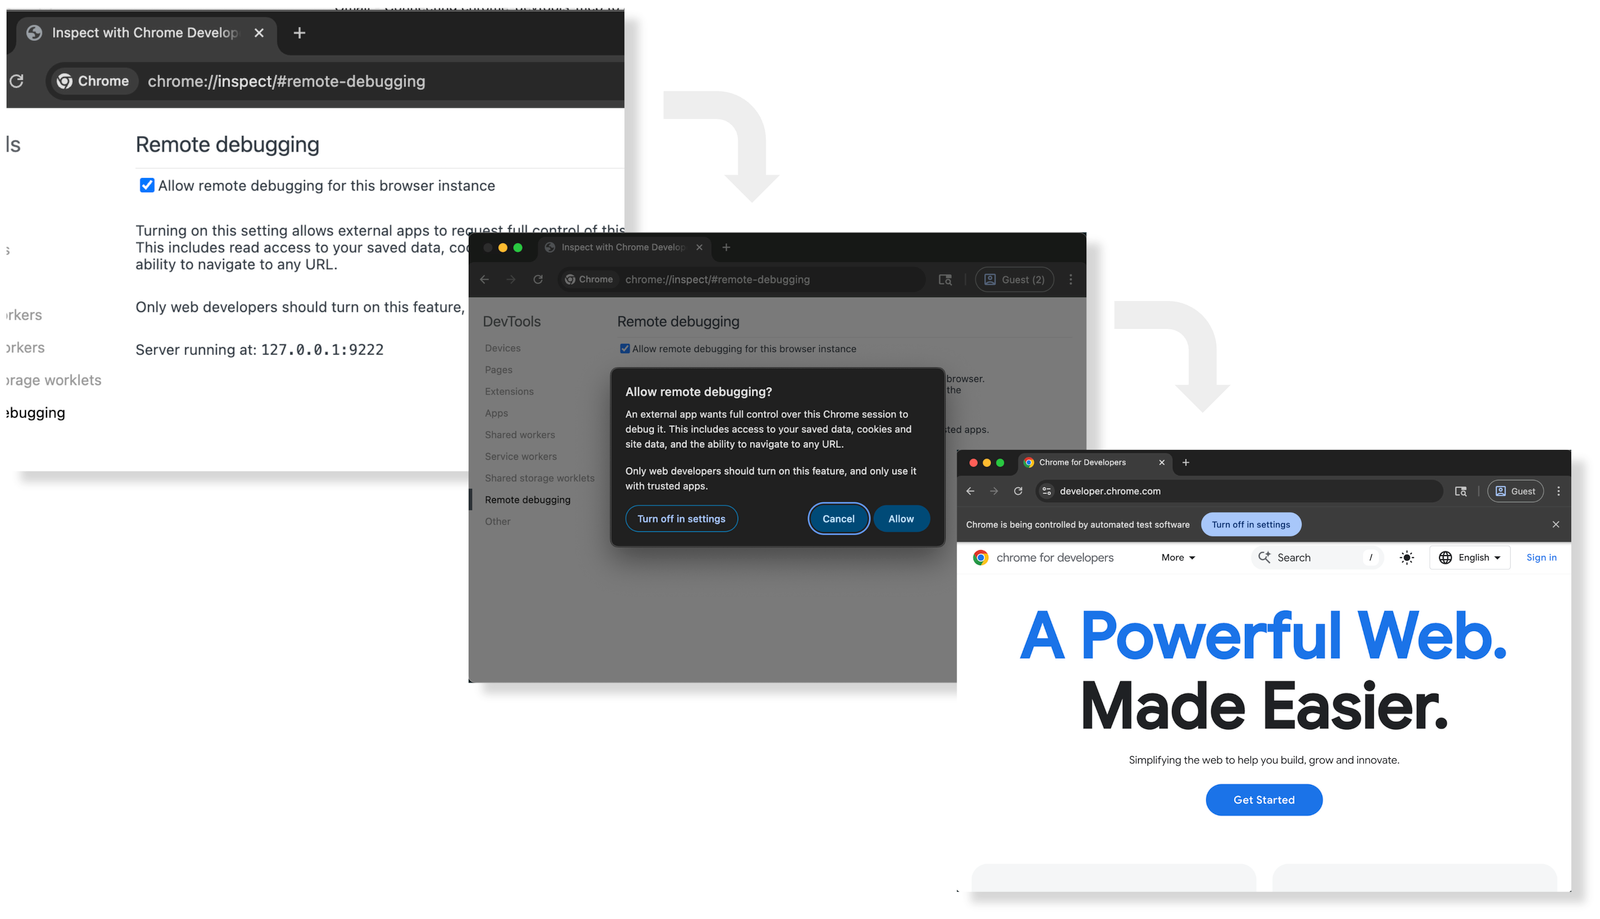
We’ve added a new feature to Chrome M144 (currently in Beta) that allows the
Chrome DevTools MCP server to request a remote debugging connection. This new
flow builds on top of the existing remote debugging capabilities of
Chrome. By default, remote
debugging connections are disabled in Chrome. Developers have to explicitly
enable the feature first by going to chrome://inspect#remote-debugging.
When the Chrome DevTools MCP server is configured with the --autoConnect
option, the MCP server will connect to an active Chrome instance and request a
remote debugging session. To avoid misuse by malicious actors, every time the
Chrome DevTools MCP server requests a remote debugging session, Chrome will show
a dialog to the user and ask for their permission to allow the remote debugging
session. In addition to that, while a debugging session is active, Chrome
displays the “Chrome is being controlled by automated test software” banner at
the top.
Get started
To use the new remote debugging capabilities. You have to first enable remote
debugging in Chrome and then configure the Chrome DevTools MCP server to use the
new auto connection feature.
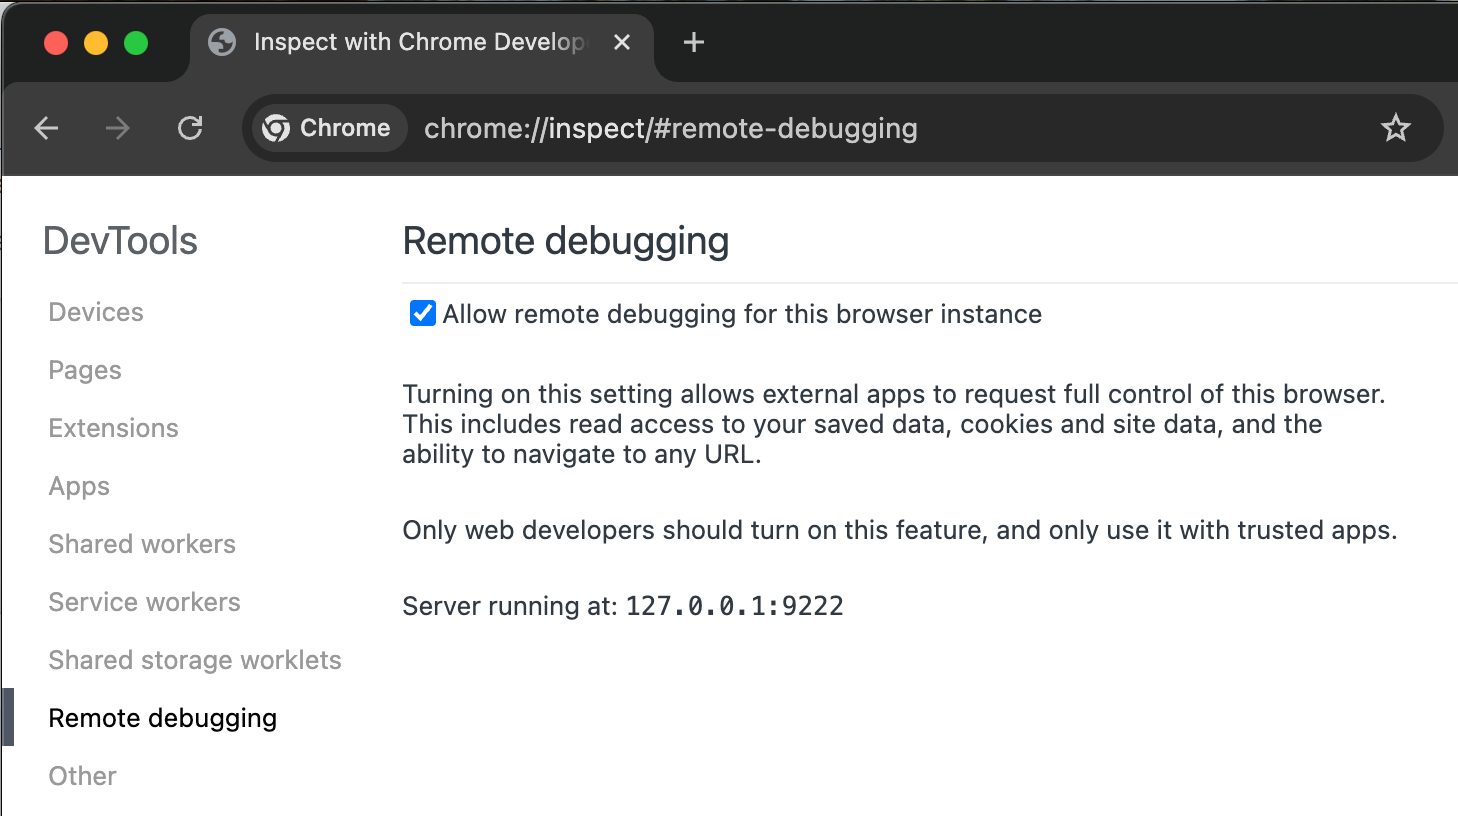
Step 1: Set up remote debugging in Chrome
In Chrome (>=144), do the following to set up remote debugging:
- Navigate to
chrome://inspect/#remote-debuggingto enable remote debugging. - Follow the dialog UI to allow or disallow incoming debugging connections.
Step 2: Configure Chrome DevTools MCP server to automatically connect to a running Chrome Instance
To connect the chrome-devtools-mcp server to the running Chrome instance, use
--autoConnect command line argument for the MCP server set.
The following code snippet is an example configuration for gemini-cli:
⚡
Step 3: Test your setup
Now open gemini-cli and run the following prompt:
Check the performance of https://developers.chrome.com
The Chrome DevTools MCP server will try to connect to your running Chrome
instance. It shows a dialog asking for user permission:
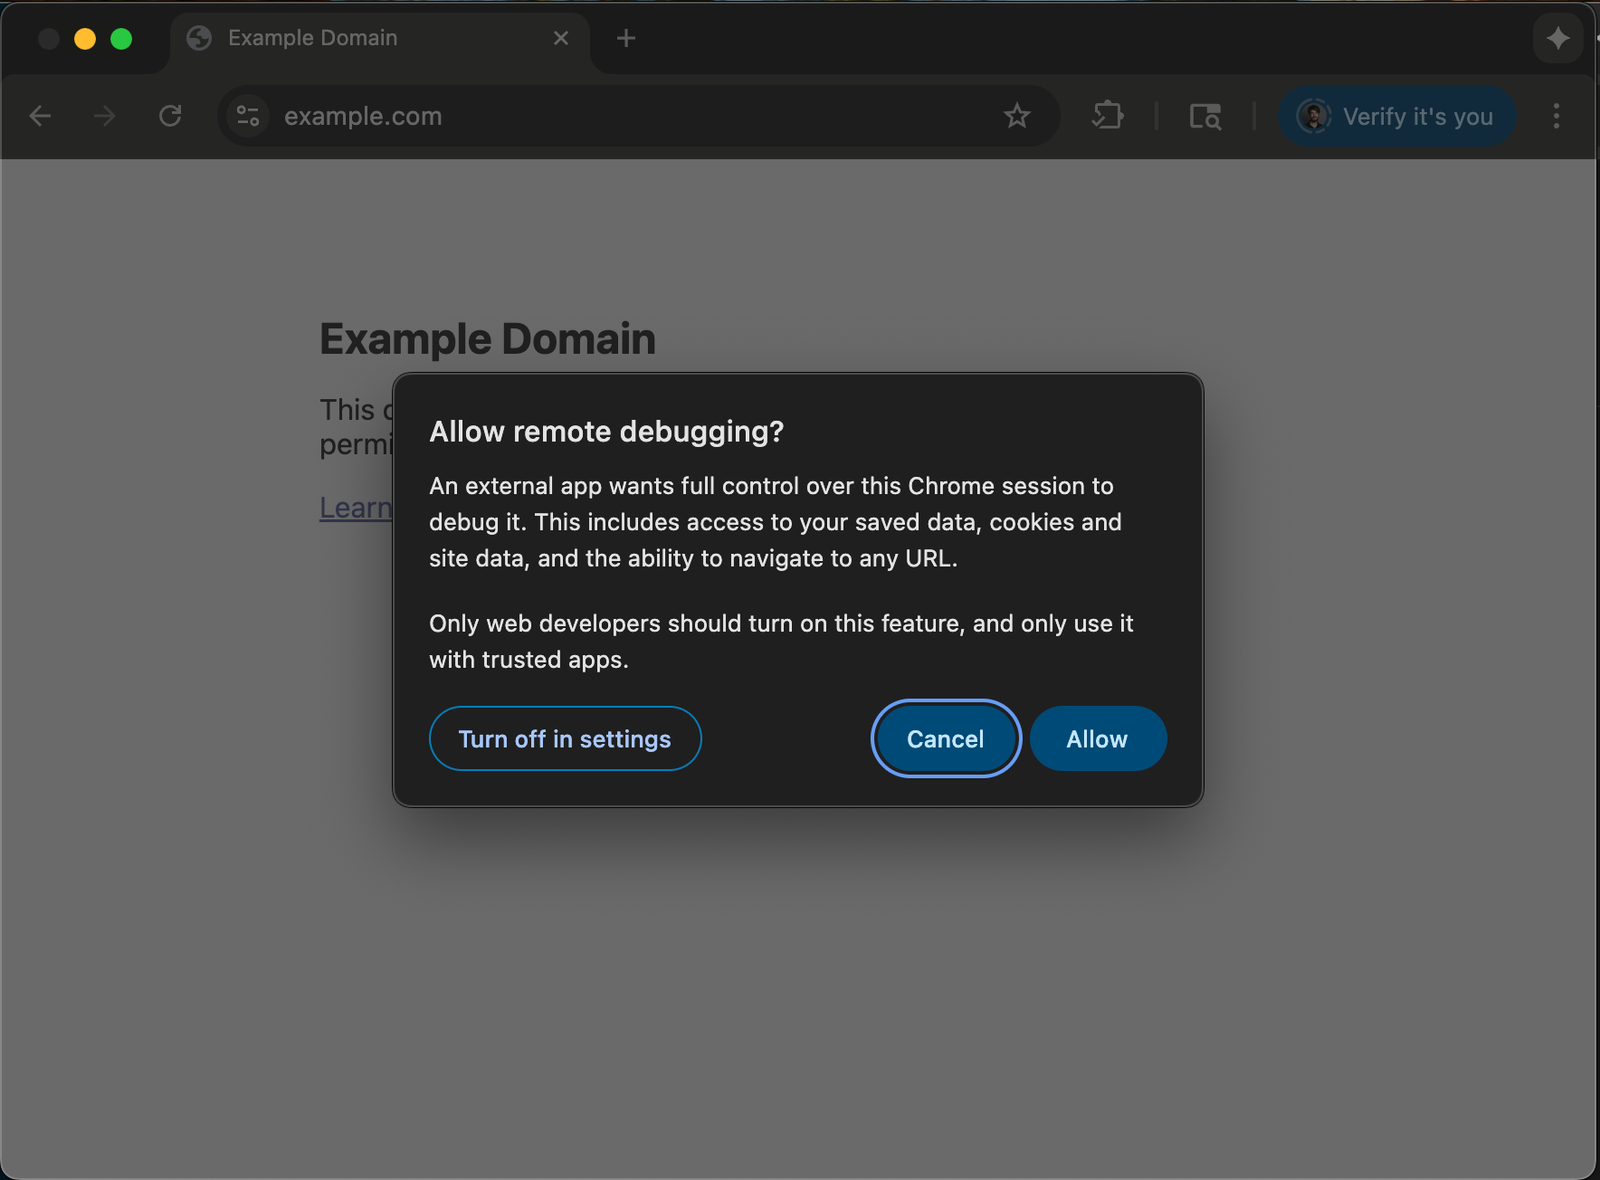
Clicking Allow results in the Chrome DevTools MCP server opening
developers.chrome.com and taking a performance
trace.
For full instructions, check out the README on
GitHub.
Let your coding agent take over your debugging session
Being able to connect to a live Chrome instance means you don’t have to choose
between automation and manual control. You can use DevTools yourself or hand
over a debugging task to your coding agent. If you discover a problem on your
website, you can open DevTools to take a look to identify the element that’s
causing the issue. If you want your coding agent to fix the issue, you can now
do so with Chrome DevTools MCP Server. You can select the element in the
Elements panel and ask the coding agent to investigate the issue.
The same also works for the Network panel. You can select a network request and
ask your coding agent to investigate it.
But this is just a first step. We plan to incrementally expose more and more
panel data to coding agents through the Chrome DevTools MCP Server. Stay tuned!
⚡ **What’s your take?**
Share your thoughts in the comments below!
#️⃣ **#Coding #Agent #debug #browser #session #Chrome #DevTools #MCP #Blog #Chrome #Developers**
🕒 **Posted on**: 1773610100
🌟 **Want more?** Click here for more info! 🌟