🚀 Explore this awesome post from Hacker News 📖
📂 **Category**:
📌 **What You’ll Learn**:
Have you wondered why the stock market has been so choppy since
October and why crypto and gold keep flash crashing? The western media
would have you believe this is due to AI bubble, war in Greenland, and
Trump’s tweets. We have a better story to tell.
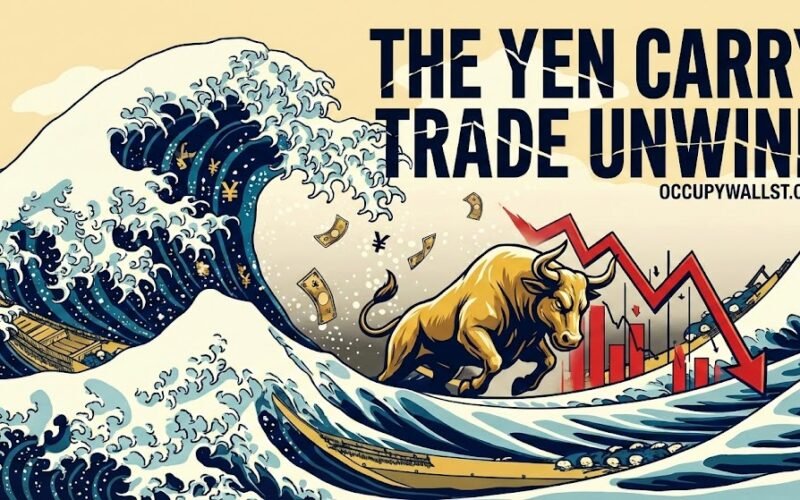
Wall Street has lost control of the
Japanese Yen carry trade unwind.
There’s been a fair bit of quiet chaos in financial markets recently.
Cryptocurrencies have lost 40% of their value. We saw silver drop 40%
which hasn’t happened since 1980. Stocks like Microsoft are getting
picked off one-by-one with 15% drops when positive earnings reports come
out. Meanwhile the broader market chops sideways, so people think things
are fine. Trump and Europe were on the brink of war for control of a
desolate arctic territory. Truth Social has overtaken FOMC as the most
important source of financial news. These things may all appear to the
untrained eye as a series of idiosyncratic, disconnected shocks. The
prevailing media narrative is that the market is reacting negatively to
AI CapEx spending and a hawkish new Fed chair. But our systematic
analysis of cross-asset flows, derivatives positioning, central bank
policy minutes, and institutional balance sheets suggests a singular,
unified causality that binds these disparate anomalies, which is the
covert unwinding of the Japanese Yen carry trade.
For nearly thirty years, the Bank of Japan’s (BOJ) Zero Interest Rate
Policy (ZIRP) and subsequent Negative Interest Rate Policy (NIRP)
effectively transformed the Yen into the world’s funding currency. We
would call it the greatest free money printer ever made. By anchoring
borrowing costs at or near zero, the BOJ enabled Wall Street to borrow
Yen cheaply and invest it with leverage into higher yielding instruments
globally, such as U.S. treasuries, equities, and cryptography. For
example, you borrow Yen from Japan at 0% interest, you exchange it for
USD, and then you buy treasury bonds that pay 4%. It’s that simple. This
funded government benefits and provided continuous reliable liquidity
for financial markets that made stocks keep going up while suppressing
volatility.
Trillions of dollars of free loans from the Bank of Japan were used
by a generation of investors to buy a double digit percentage of the
U.S. economy. Now those loans are being recalled. Wall Street traders
who levered up on the free Japanese money now have to sell trillions of
assets and convert the proceeds back to Yen in order to not be
liquidated. These aren’t happy times for them. They get liquidated when
Japan raises interest rates; they get liquidated when the Federal
Reserve lowers interest rates; they get liquidated when the Japanese Yen
increases in value; they get liquidated when tech stocks aren’t going up
enough, and all four of these things have been happening at once.
Wall Street may be greedy, but they’re very intelligent too. They
made many smart choices about where to put the “free” money. Now let’s
say you’re someone who’s also smart, but was wise enough to not use
Sauron’s ring. Chances are you invested in the same things as Wall
Street. So by now you’ve probably seen your whole portfolio move against
you; you’re wondering why your hedges don’t work; and you feel like
you’re being punished for making all the right choices. It’s because
other smart people, who got greedy, are being forced to close their
positions, and you’re the whipping boy for their avarice.
The Japanese Yen is sort of like GameStop ($GME). It’s the most
shorted currency on Earth. When you borrow yen to buy American assets,
you’re effectively shorting the yen. Currency can be rehypothecated so
that yen-denominated debt ends up exceeding the actual yen supply, the
same way GME’s short interest exceeded 100% of its float. When shorts
start covering it compounds tragedy, because they all have to buy yen,
which makes its value increase, forcing more shorts to cover, and Japan
is a small island.
This December 2025 rate hike to 0.75%, followed by the explicitly
hawkish signalling from Prime Minister Sanae Takaichi’s administration,
has fundamentally altered the risk-reward calculus of these leveraged
positions. The market disruptions observed in January 2026 bear the
distinct mathematical signature of a forced liquidation event rather
than a fundamental repricing of growth prospects. When correlations
between historically uncorrelated assets (e.g. Gold, Bitcoin, Microsoft,
and Silver) approach 1.0 during a sell-off, it serves as a distinct
indicator that traders are not selling what they want to sell,
but rather what they must sell in order to meet margin calls in
a funding currency that is rapidly appreciating against their
liabilities.
We shall investigate the mechanics of this unwind in exhaustive
detail. We analyze the “Greenland Distraction” not as a root cause but
as a volatility trigger that shattered the complacent calm of the “Davos
Consensus.” We examine the anomalous liquidation in precious metals
following the nomination of Kevin Warsh to the Federal Reserve
Chairmanship, and we dissect the flow of funds from major Japanese
institutional whales like Norinchukin Bank, whose retreat from foreign
bond markets has left a liquidity vacuum in the U.S. Treasury complex.
The evidence points to a systemic repricing of the global cost of
capital, originating in Tokyo and transmitting violently through the
plumbing of Wall Street, leaving no asset class untouched.
Japan’s Monetary Normalization
To fully comprehend the market chaos of January 2026, one must look
beyond the immediate headlines of the new year and scrutinize the subtle
yet seismic shifts that occurred in Tokyo during the closing months of
2025. The conventional market narrative has long regarded the Bank of
Japan as a passive, almost paralyzed actor, perpetually trapped in a
deflationary mire and unable to normalize policy. This view has always
been demonstratably false. The truth is that Wall Street leaders have
been planning for the next quarter, while the Japanese have been
preparing for the next century. The data confirms a deliberate,
aggressive shift toward normalization that caught global carry traders
offguard.
1.1 The December 2025 Rate Hike: A Regime Change
In a move that many Western analysts critically underestimated, the
Policy Board of the Bank of Japan voted unanimously to raise the
uncollateralized overnight call rate to 0.75% during
its policy session on December 18-19, 2025. While a 25 basis point hike
might appear negligible in the context of Federal Reserve or ECB
tightening cycles, in the context of the Japanese financial system,
which has operated near the zero-bound for decades, it represents a
massive tightening of financial conditions.
This move was not merely a technical adjustment; it was a fundamental
regime change. Coming from a baseline of -0.1% in early 2024 and 0.50%
in late 2025, the move to 0.75% signaled that the era of “free money”
had definitively ended. The rationale provided by the BOJ was grounded
in shifting inflationary dynamics. Core CPI (excluding fresh food), the
central bank’s preferred metric, was tracking near 3% in late 2025,
persistently exceeding the 2% price stability target.Although inflation
eased slightly to 2.4% in December, the BOJ minutes reveal a board
convinced that “wage gains may be durable,” thus justifying higher rates
to prevent a wage-price spiral.
Crucially, the minutes from the December meeting, which were released
in late January 2026, contain explicit language suggesting that the
tightening cycle is far from complete. The board noted that “real
interest rates are expected to remain negative,” implying that a policy
rate of 0.75% is still considered accommodative relative to
inflation.To a bond trader, this is hawkish code. It suggests that the
“neutral rate” is significantly higher, potentially between 1.5% and
2.0%. If the market prices in a terminal rate of 2.0%, the cost of
funding for carry trades effectively triples from previous levels,
turning profitable arbitrage positions into deep losses.
1.2 The Takaichi Factor: “Abrynomics” Redux?
The political dimension in Japan has exacerbated the monetary
tightness, creating a “double tightening” effect that algorithms have
struggled to price. Prime Minister Sanae Takaichi, preparing for a snap
election on February 8, 2026, has adopted a complex economic stance that
blends fiscal expansion with monetary discipline, a volatile mix for
currency markets.
Takaichi advocates for “strategic fiscal spending” and tax cuts to
stimulate the domestic economy. In standard macroeconomic theory, an
expansionary fiscal policy (increased government spending) combined with
a tightening monetary policy (higher rates to combat the resulting
inflation) is the perfect recipe for currency appreciation. While
Takaichi has publicly softened her rhetoric to avoid accusations of
currency manipulation, stating she “did not have a preference for the
yen’s direction”, her policies speak louder than her soundbites.
The market fears that Takaichi’s proposed fiscal largesse will force
the BOJ to hike rates faster than currently projected to
counteract the inflationary effects of government spending. This creates
a two-front war on the Yen carry trade:
-
Cost of Funding Rises: Higher BOJ rates make borrowing Yen expensive.
-
Exchange Rate Risk: If the Yen appreciates due to the fiscal-monetary policy mix, the principal value of the USD-denominated assets held by Japanese investors falls in Yen terms, triggering margin calls.
The tension between the Prime Minister’s office and the Ministry of
Finance (MOF) adds another layer of uncertainty. Finance Minister
Satsuki Katayama has been far less tolerant of currency volatility,
repeatedly intervening or threatening intervention when USD/JPY
approaches the 155-160 danger zone.This political friction creates a
“floor” for the Yen, making shorting the currency a perilous endeavor
for global macro funds.
1.3 Institutional Flows: The “Whale” Retreats
Perhaps the most critical, yet underreported, development is the
behavior of Japan’s gargantuan institutional investors,
specifically Norinchukin Bank (often referred to as the
“CLO Whale”) and Nippon Life Insurance. These entities
have historically been the largest buyers of U.S. debt, recycling
Japan’s trade surplus into U.S. Treasuries and corporate bonds.
The data indicates a massive reversal in these flows. Following
significant losses in 2024 and 2025 due to unhedged exposure to U.S. and
European sovereign bonds, Norinchukin has been actively liquidating
foreign assets. By the end of December 2025, the bank had unloaded
nearly ¥12.8 trillion (approximately $88 billion) in
foreign government bonds.The bank’s CEO, Taro Kitabayashi, confirmed the
completion of this sell-off, stating the bank would “take its time”
before committing capital to fresh investments.
The significance of this cannot be overstated. A major,
price-insensitive buyer of U.S. debt has left the building. When the
U.S. Treasury issues debt to fund its deficit, Norinchukin is no longer
the guaranteed bid. This removal of liquidity support weakens the floor
for U.S. Treasuries, contributing to the yield spikes seen in January.
Similarly, Nippon Life has signaled a rotation back into domestic
Japanese Government Bonds (JGBs), acknowledging that “unrealized losses”
on foreign bonds had swelled to ¥4.7 trillion.The logic is simple: why
take currency risk for a 4.5% U.S. yield when domestic JGB yields are
rising and offer a risk-free return in your home currency?
By December 31, 2025, the stage was set. The “free money” era was
over. The largest holders of capital in Tokyo were repatriating funds or
moving into cash. Global markets, however, were still positioned for
“business as usual”, long Nvidia, long Bitcoin, short Yen. The dissonance
between Japanese reality and Western positioning created the perfect
conditions for a crash.
Timeline of the Crisis
To validate the thesis that the Yen unwind is the primary driver of
volatility, we must examine the sequence of events. The crash did not
happen in a vacuum; it followed a precise timeline where geopolitical
shocks acted as triggers for a structural fragility that had been
building since the BOJ’s December pivot.
2.1 The Lead-Up: October to December 2025
The pressure began to build in Q4 2025. As the BOJ signaled its
intention to hike rates, Japanese traders, often the “canary in the coal
mine” for global liquidity, began to reduce risk. This cycle started with
Bitcoin. Bitcoin is a pure
liquidity asset; it has no yield and is often funded via margin. As the
cost of Yen margin rose, Japanese selling pressure on Bitcoin
intensified from October through December.This was the first tremor.
2.2 The Catalyst: The “Greenland Crisis” (January 17-21, 2026)
Was the “Greenland War” theater? While the military dimensions may have
been performative, the economic consequences were
tangible and acted as the catalyst that exposed the fragility of the Yen
carry trade.
On January 17, 2026, President Trump escalated his demand to purchase
Greenland by threatening a 10% tariff on eight European
nations (including the UK, Germany, and France) and escalating to 25% by
June if the territory was not ceded.This introduced a “tail risk” that
markets had not priced: the fracture of the Atlantic economic
alliance.
Following the Martin Luther King Jr. holiday, U.S. markets opened on
January 20 to a bloodbath. The S&P 500 fell 2.1%, the Nasdaq
composite dropped 2.4%, and yields on U.S. Treasuries spiked.The
narrative was “Greenland,” but the market mechanics told a different
story. The threat of tariffs on close allies disrupts the “Atlantic
Trade” narrative. For Japanese investors holding U.S. assets, this
introduced a new risk premium. It wasn’t just about rates anymore; it
was about the stability of the U.S.-led global order. This geopolitical
volatility forced risk parity funds and algorithmic traders to reduce
gross exposure. When a global portfolio deleverages, it buys back its
funding currency. In this case, it bought Yen.
While Trump walked back the military threat on January 21 at
Davos, the economic threat of tariffs remained a live wire. The
volatility persisted, suggesting that the “Greenland” narrative was
merely the match that lit the fuse of a much larger powder keg.
2.3 The “Warsh Shock” and the Liquidity Event (January 30-31, 2026)
The final and most violent phase of the crash occurred at the end of
the month, triggered by the nomination of Kevin Warsh as Federal Reserve
Chair.Warsh is widely perceived as a hawk, favoring sound money and
skepticism toward quantitative easing. His nomination signaled the
potential end of the “Fed Put”, the assumption that the central bank
would always intervene to support asset prices.
This announcement triggered a massive repricing of the “Debasement
Trade.” Assets that thrive on currency debasement, Gold, Silver, and
Bitcoin, collapsed. Gold fell ~11%, and Silver crashed ~36% in a single
session.This synchronization of losses across uncorrelated assets (Tech
and Gold falling together) is the definitive signature of a liquidity
crisis driven by margin calls.
Anatomy of the Liquidation
The unwinding of a carry trade is not a monolithic event; it is a
cascade that ripples outward from the most liquid and speculative assets
to the core holdings of institutional portfolios. The sequence of asset
price collapses observed from October 2025 to January 2026 follows this
classic liquidation hierarchy perfectly.
3.1 The Canary in the Coal Mine: Bitcoin
As noted, the unwind began in the crypto markets. Japan is home to a
massive retail crypto trading base, and the Yen is a major pair for
Bitcoin trading. Snippets indicate that Japanese traders began selling
off Bitcoin in October 2025.
This timing is crucial. It correlates with the period when the BOJ
began signaling the December rate hike. Retail traders, facing higher
mortgage rates and loan costs in Japan, likely liquidated their most
volatile, liquid asset first to raise cash. The selling was exacerbated
by the looming tax reform in Japan. While the proposal to move to a flat
20% tax rate is bullish in the long term, the immediate pressure of
rising funding costs forced traders to sell before the tax cut
could be realized.By January 31, massive outflows from Bitcoin ETFs
($528 million) coincided with the broader market crash, confirming that
crypto was being used as a source of liquidity to cover losses
elsewhere.
3.2 The “Tech Wreck”: The Microsoft Anomaly
Consider the “painful ~3% dump” in the Nasdaq and Microsoft’s
staggering 15% drop. On January 29, 2026,
Microsoft reported earnings. Despite beating revenue estimates ($81.27
billion vs. $80.28 billion), the stock plummeted ~11-15% intraday.
The street blamed concerns over “AI CapEx”, the idea that Microsoft
was spending billions on data centers with slow return on investment.
However, a 15% drop in a $3 trillion company on a “good” earnings beat
is rarely fundamental; it is mechanical. Microsoft is a quintessential
“momentum” stock, heavily held by foreign institutional investors,
including Japanese pension funds. When the Yen strengthens, the value of
these USD-denominated assets falls in JPY terms.
If a Japanese insurer holds Microsoft unhedged, a falling USD/JPY
exchange rate hurts their balance sheet. If they hold it hedged
(rolling short USD positions), the rising U.S. rates (driven by the
Warsh nomination) make the hedge prohibitively expensive. The January 29
drop was likely exacerbated by a “stop-loss” cascade from Tokyo desks.
As the price broke key technical levels, algorithms programmed to
protect Yen-denominated returns indiscriminately sold the most liquid
blocks. Microsoft, being one of the most liquid stocks in the world,
became the ATM for the rest of the portfolio.
3.3 The Precious Metals Flash Crash
The most compelling evidence of a forced liquidation event is the
behavior of Gold and Silver on January 31, 2026. Gold fell ~11-12% and
Silver crashed ~31-36% in a single session. Historically, Gold acts as a
safe haven during equity market turmoil. If the Nasdaq is crashing due
to “Greenland” fears, Gold should rally. Instead, it crashed.
This anomaly can be explained by two factors:
-
The Warsh Effect: As discussed, Warsh’s nomination strengthened the USD and undermined the thesis for holding anti-fiat assets.
-
Margin Call Dynamics: Snippets reveal that CME Group and the Shanghai Gold Exchange raised margin requirements on gold and silver futures days before the crash.When Japanese traders faced losses on their Microsoft longs and their Yen shorts, they needed cash immediately. They couldn’t sell illiquid bonds quickly enough, so they sold their “winners.” Gold had rallied to ~$5,400/oz prior to the crash. Traders liquidated their profitable Gold positions to pay for the margin calls on their losing Tech and Yen positions.
Correlation Convergence: The Signature of a Liquidity Event
Cross-Asset Correlations (Week Ending Jan 31, 2026)
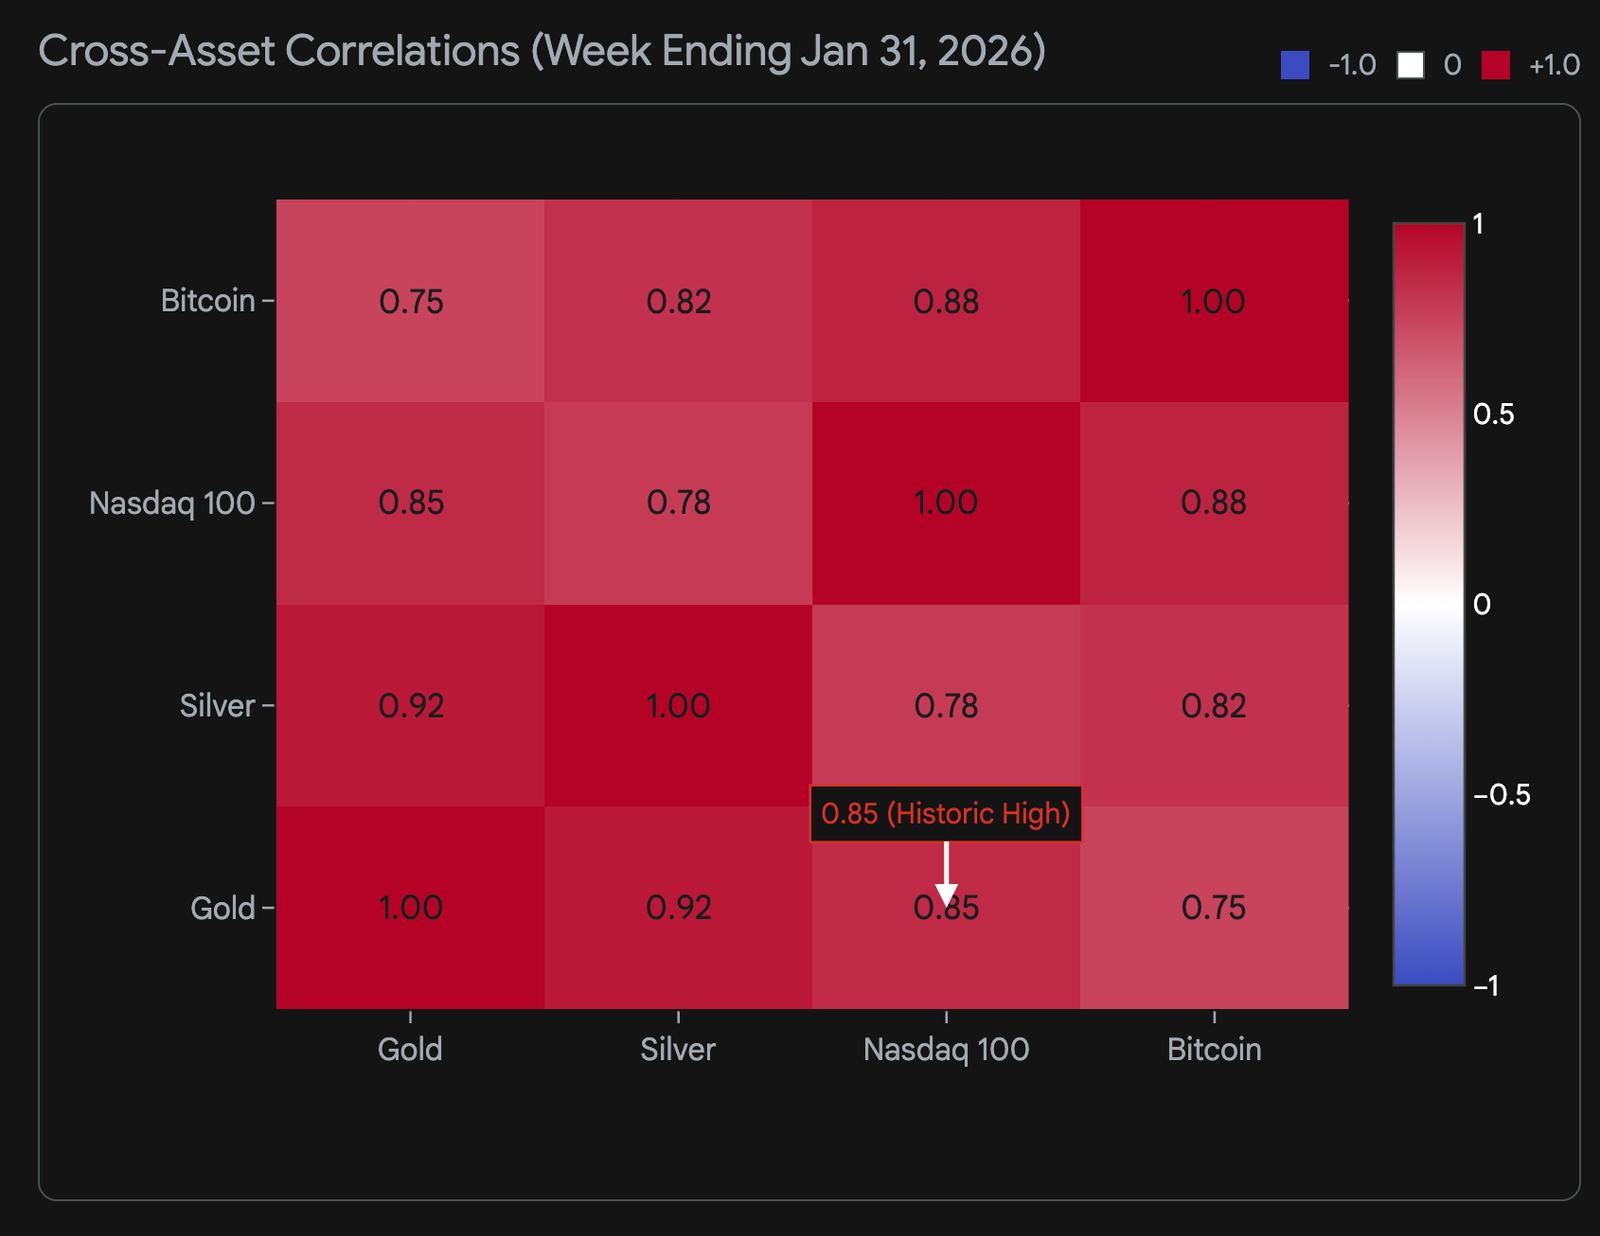
2026. Note the spike in correlation between Gold, Bitcoin, and
Nasdaq 100 on Jan 31, indicating a systemic “sell-everything” margin
call.
Data sources:
Alex Lexington,
Finance Magnates,
Morningstar,
Investing.com,
Seeking Alpha
This correlation breakdown is visualized in Figure 2, where the
correlation between Gold and the Nasdaq 100 spikes to nearly 1.0 during
the crash week, a statistical anomaly that only occurs during severe
liquidity events.
The Liquidation Vice: Margin Hikes vs. Silver Price
increases on Silver spot prices (Jan 20–Feb 2, 2026). The “Step Up”
in margin cost precedes the vertical drop in price, characteristic
of a forced unwind.
Data sources:
Alex Lexington,
Finance Magnates,
Evrim Agaci
The Plumbing of the Crisis
The “Yen Whale” hypothesis is strongly supported by the data on
futures volumes and repo market stress. The “central mystery” is not
just in the price action, but in the unseen flows of the derivatives
market.
4.1 The /6J (Yen Futures) Whale
About a week ago, some whale kicked off an astronomically large
market order for a /6J long when it hit all-time lows. /6J (CME Yen
Futures) hit a low of ~0.00647 (approximately 154.50 USD/JPY) in late
January. This level has historically been a “line in the sand” for the
Japanese Ministry of Finance (MOF).
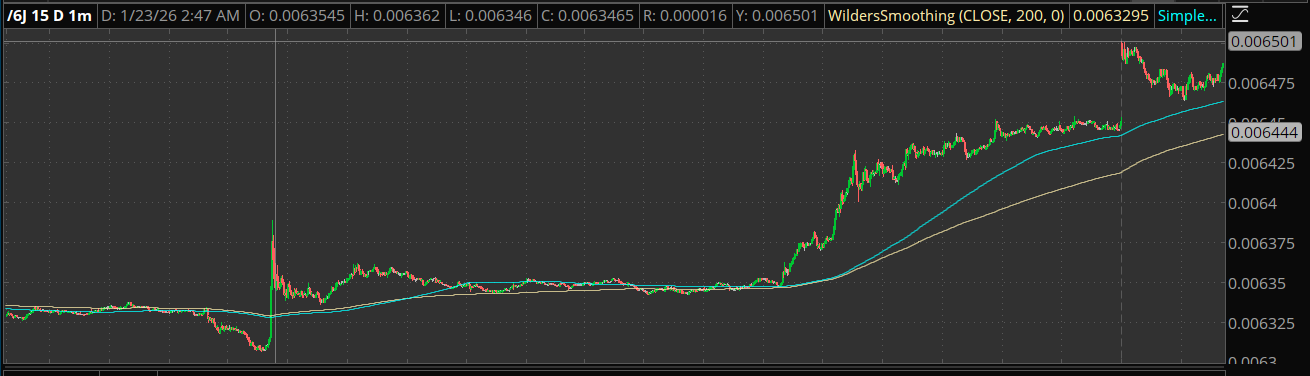
the Japanese Yen unwind. Note the massive spike as /6J hit all-time
lows, rallying investors worldwide to go long on yen
futures.
CME reported record volumes in FX and Interest Rate products for
January 2026.The aggressive buying off the lows suggests a
massive repatriation flow. Who is the Whale? Two theories
emerge:
-
The MOF Thesis: The Ministry of Finance has a history of stealth intervention. Buying /6J (Long Yen) is functionally equivalent to selling USD reserves. Buying futures allows them to support the currency without immediately depleting cash reserves, squeezing speculators who are short.
-
The Carry Unwind: A massive hedge fund or bank (like Norinchukin) realizing that the “game is up” and closing out short-Yen positions. The size of the order suggests an entity that needed to move billions, not millions.
The subsequent price action, a sharp rally followed by “hammering back
down”, represents the battleground. U.S. macro funds are still trying to
short the Yen (betting on U.S. economic exceptionalism and Warsh’s
policies), while Japanese domestic accounts are buying it. The
volatility is the result of these tectonic plates grinding against each
other.
4.2 The Repo Market & ON RRP
The plumbing of the U.S. financial system showed signs of stress that
coincided with the Japanese retreat. The Overnight Reverse Repo facility
(ON RRP) saw a year-end spike to $106 billion but has since drained.
Japanese banks are typically huge participants in the U.S. repo
market to fund their dollar assets. As Norinchukin and others retreat
(repatriating funds to Japan), liquidity in the U.S. repo market becomes
thinner. The “air pocket” in Microsoft and Gold prices was likely
exacerbated by a lack of market maker depth in the repo-funded
derivatives market. When market makers cannot access cheap repo funding,
they widen spreads and reduce liquidity provision, leading to “gaps” in
price action during sell-offs.
4.3 Peripheral Currency Volatility
There have been significant moves in other currency futures as well: /6A
increased 87 basis points, /6L rose 19 basis points, and /6S rose 18
basis points.
-
/6A (Australian Dollar): The 87 basis point rise
in the Aussie Dollar is notable. AUD is often a proxy for Chinese
growth and global risk sentiment. A rise here, amidst a tech crash,
suggests a rotation out of U.S. assets and into
commodities or Asia-Pacific currencies, further supporting the
“Sell America” thesis triggered by the Greenland tariff
threats. -
/6L (Brazilian Real) and /6S (Swiss Franc): The
rise in the Swiss Franc (a classic safe haven) aligns with the
risk-off sentiment. The move in the Brazilian Real suggests that
emerging markets are also seeing volatile flows as the dollar
stabilizes.
4.4 The VIX Anomaly
Why was the VIX at 16 despite the chaos? The VIX measures implied
volatility of S&P 500 options. Its relatively low level (16)
compared to the violence in individual names (MSFT -15%, Gold -11%)
indicates that the crash is a de-leveraging event, not
a panic event.
In a panic, investors buy Puts on the index to protect themselves,
spiking the VIX. In a de-leveraging event, investors simply sell the
underlying assets (stocks, gold, crypto) to raise cash. They are not
hedging; they are exiting. This explains why the VIX remained subdued
while prices collapsed, the selling was orderly, algorithmic, and
relentless, rather than emotional and panicked.
The Greenland Distraction
Skepticism about the “Greenland War” is well-founded. While the
diplomatic row was real, its utility as a financial
narrative was far greater than its geopolitical reality.
5.1 The “Davos Pivot”
President Trump’s threat of military force was retracted on January
21 at Davos.This “de-escalation” should theoretically have calmed
markets. Instead, the volatility worsened into month-end. This
confirms that the real problem wasn’t Greenland; it was the
re-pricing of the Yen.
5.2 The Narrative Utility
The financial media loves a simple cause-and-effect narrative.
“Stocks down because of War” is easy to digest. “Stocks down because the
cross-currency basis swap spread widened due to BOJ minutes” is not. The
“Greenland” narrative provided the perfect cover for sophisticated
actors to liquidate positions in Gold and Tech under the guise of “war
jitters.” This allowed them to exit without sparking a broader panic
about liquidity in the banking system. The focus on the Arctic
masked the structural rot in the leverage complex.
Conclusion
The evidence suggests a covert, structural unwinding of the Yen carry
trade is the primary driver of the January 2026 market chaos.
The interconnectedness of these events is undeniable. The BOJ’s rate
hike in December 2025 and the subsequent hawkish signaling from the
Takaichi administration fundamentally altered the cost of capital for
the world’s largest carry trade. The “Greenland Crisis” acted as the
initial volatility trigger, forcing a reduction in gross exposure. The
nomination of Kevin Warsh acted as the final catalyst, shattering the
“Debasement Trade” and forcing a liquidation of precious metals and
crypto to cover margin calls on Yen-funded positions.
Here are some key takeaways:
-
The “Free Money” Era is Over: BOJ policies have
fundamentally altered the global cost of capital. The flow of
liquidity from Tokyo to New York has reversed. -
Geopolitics as Catalyst: “Greenland” may have
been the spark, but the Yen leverage was the powder keg. The tariff
threats disrupted the “Atlantic Trade” narrative, forcing a
repatriation of capital. -
Liquidity Event: The synchronized crash of Gold,
Crypto, and Tech confirms a systemic de-leveraging. The “Whale”
orders in Yen futures and the breakdown of correlations are the
smoking guns of a margin-driven event.
With the Japanese election on February 8 and U.S. tariffs looming,
the “hammering” of the Yen is likely temporary. The structural trend is
now toward repatriation. This implies lower U.S. asset prices,
higher U.S. yields, and a stronger Yen over the medium term.
The “mystery” of the low VIX is explained by the mechanical nature of
the unwind, a controlled demolition of leverage rather than a chaotic
panic.
Call To Action
This won’t just be the big one. This could be the last one. If you’ve
been preparing your whole life, knowing that something’s coming, then
this could be the thing you’ve been preparing for. One final opportunity
to get the guys who did this.
Longing the Yen is commonly referred to as “The Widowmaker Trade” on
Wall Street, because you have trillions of dollars of monopoly money
working against you. The carry traders have compromised every level of
our government. Their greatest vulnerability is the Yen rising in value.
They will do anything to defend their positions, even if that means
bringing America’s economy down with them. Since recent events have made
it obvious they’re going to lose, we might as well fight them. Most of
us probably won’t make it out of this fight. But if we at least try,
then there’s a chance we might prosper when it’s over.
The IV on
OTM CME
/6J futures calls is 11% which is astonishingly low. The same is
true for calls on the
FXY
ETF. Call options have defined risk. The more Yen we control, the more
its value goes up, and the more crooks on Wall Street get liquidated.
The worst that can happen is you lose your monopoly money, but that’s
been happening anyway. Since carry traders own 10% of all U.S.
treasuries, when they get liquidated they’ll have to sell a lot of
treasury bonds, which means that
CME
/UB futures and
the TLT
ETF will fall.
This blog is brought to you by various radicals,
malcontents, and people who think the system is rigged. We’re not
affiliated with any organization. Nothing here constitutes financial
advice. Occupy Wall Street is not your financial advisor or your lawyer.
We’re retail investors like you. Do your own research. Past performance
does not guarantee future results. We are the 99 percent. The only
solution is world revolution. Wall Street’s time has finally come.
💬 **What’s your take?**
Share your thoughts in the comments below!
#️⃣ **#Great #Unwind**
🕒 **Posted on**: 1770233698
🌟 **Want more?** Click here for more info! 🌟